Solution: Continuity #1
Solution: Continuity #1
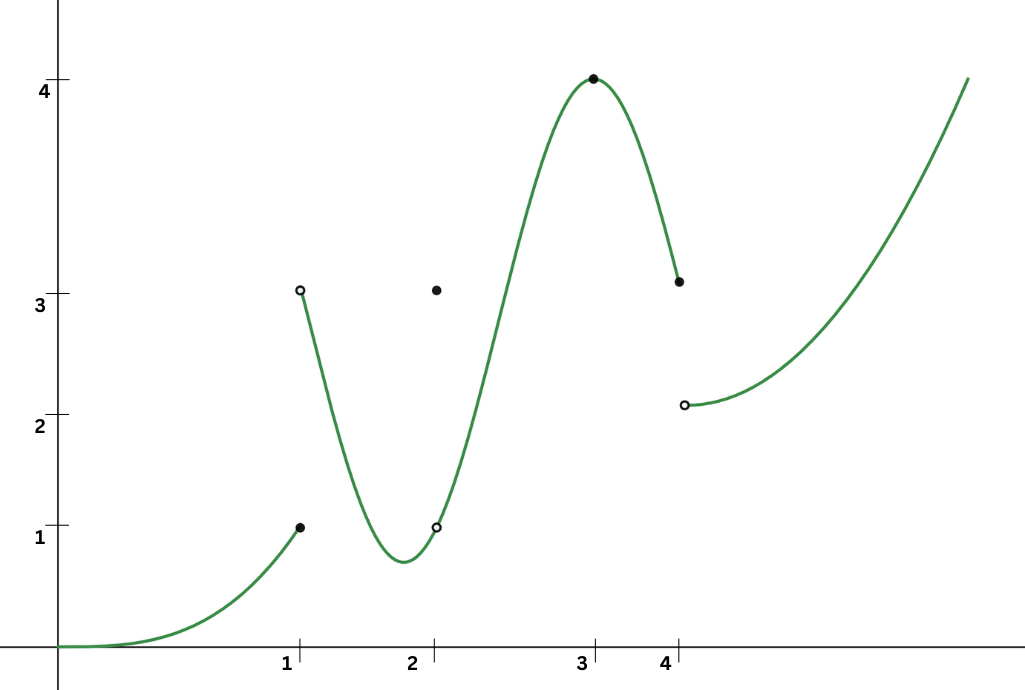
The plot of [latex]f(x)[/latex] is shown below (Not to scale). At what values of [latex]x[/latex] is this function discontinuous?
The definition of continuity tells us that a function is continuous at point x = a:
[latex]\large{\lim_{x \to a^-} f(x) = \lim_{x \to a^+}f(x) = f(a)}[/latex]
Based on this, we can inspect the graph to see where this is true. At points x = 1, 2, and 4, we can see that this is not true. Hence, the function is discontinuous as these points.
However, at x = 3, we can see that the left and right handed limits equal the value of the function. Hence, the function is continuous at x = 3.
Send us a review!
Solution: Continuity #1
The plot of [latex]f(x)[/latex] is shown below (Not to scale). At what values of [latex]x[/latex] is this function discontinuous?
The definition of continuity tells us that a function is continuous at x = a if:
[latex]\large{\lim_{x \to a^-} f(x) = \lim_{x \to a^+} = f(a)}[/latex]
Based on this, we can inspect the graph to see where this is true. At points x = 1, 2, and 4, we can see that this is not true. Hence, the function is discontinuous as these points.
However, at x = 3, we can see that the left and right handed limits equal the value of the function. Hence, the function is continuous at x = 3.
Send us a review!
Need Additional Help? Chat with a tutor now!
QUESTIONS?
If you have any questions about our services or have any feedback, do not hesitate to get in touch with us!